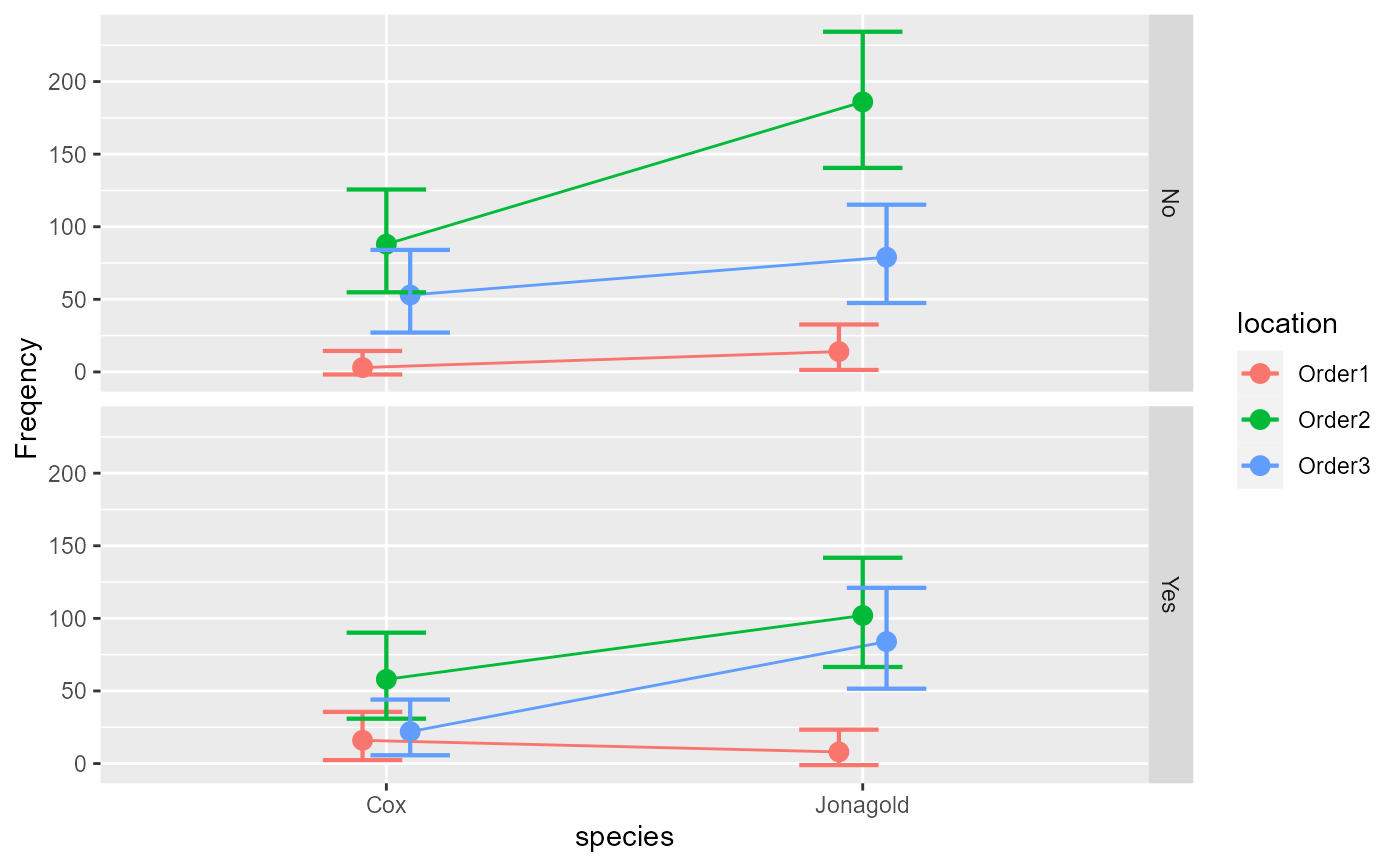
The data, taken from M. (1993)
, is a dataset examining
the distribution of apple tree to produce new branches from grafts. The study has
a sample of 713 trees subdivided into three factors:
species (2 levels: Jonagold or Cox);
location (3 levels: Order1, Order2, Order3);
is where the graft has been implanted (order 1 is right on the trunk);
and florished (2 levels: yes or no) indicates if the branch bear
flowers. It is therefore a 2 × 3 × 2 design with 12 cells.
Gillet1993Format
An object of class list.
References
M. G (1993). Contribution à la modélisation de la croissance et du développement du pommier. Faculté des Sciences agronomiques, Gembloux.
Examples
# The Gillet1993 presents data from appletrees having grafts.
Gillet1993
#>     species location florished Freq
#> 1  Jonagold   Order1       Yes    8
#> 2  Jonagold   Order1        No   14
#> 3  Jonagold   Order2       Yes  102
#> 4  Jonagold   Order2        No  186
#> 5  Jonagold   Order3       Yes   84
#> 6  Jonagold   Order3        No   79
#> 7       Cox   Order1       Yes   16
#> 8       Cox   Order1        No    3
#> 9       Cox   Order2       Yes   58
#> 10      Cox   Order2        No   88
#> 11      Cox   Order3       Yes   22
#> 12      Cox   Order3        No   53

# run the base analysis
w <- anofa( Freq ~ species * location * florished, Gillet1993)

# display a plot of the results
anofaPlot(w)


# show the anofa table where we see the 3-way interaction
summary(w)
#>                                    G df Gcorrected   pvalue   etasq
#> Total                      515.97724 11         NA       NA      NA
#> species                     77.55830  1   77.50394 0.000000 0.09811
#> location                   379.25702  2  378.90274 0.000000 0.34722
#> florished                   24.95517  1   24.93768 0.000001 0.03382
#> species:location             3.31188  2    3.29839 0.192205 0.39222
#> species:florished            0.06801  1    0.06777 0.794610 0.12578
#> location:florished           9.39076  2    9.35250 0.009314 0.36712
#> species:location:florished  21.43610  2   21.08372 0.000026 0.41984

# This returns the expected marginal frequencies analysis
e <- emFrequencies(w, Freq ~ species * location | florished )
summary(e)
#>                              G df Gcorrected  pvalue   etasq
#> species:location | No    4.869  2      4.849 0.08850 0.43332
#> species | No            43.848  1     43.817 0.00000 0.09392
#> location | No          274.732  2    274.476 0.00000 0.39375
#> species:location | Yes  19.879  2     19.798 0.00005 0.36622
#> species | Yes           33.778  1     33.755 0.00000 0.10433
#> location | Yes         113.915  2    113.809 0.00000 0.28203

# as seen, all the two-way interactions are significant. Decompose one more degree:
f <- emFrequencies(w, Freq ~ species | florished * location )
summary(f)
#>                            G df Gcorrected   pvalue   etasq
#> species | :No:Order1   7.723  1      7.718 0.172500 0.31238
#> species | :Yes:Order1  2.718  1      2.716 0.743597 0.10174
#> species | :No:Order2  35.839  1     35.814 0.000001 0.11567
#> species | :Yes:Order2 12.257  1     12.249 0.031534 0.07116
#> species | :No:Order3   5.155  1      5.151 0.397703 0.03758
#> species | :Yes:Order3 38.681  1     38.654 0.000000 0.26736