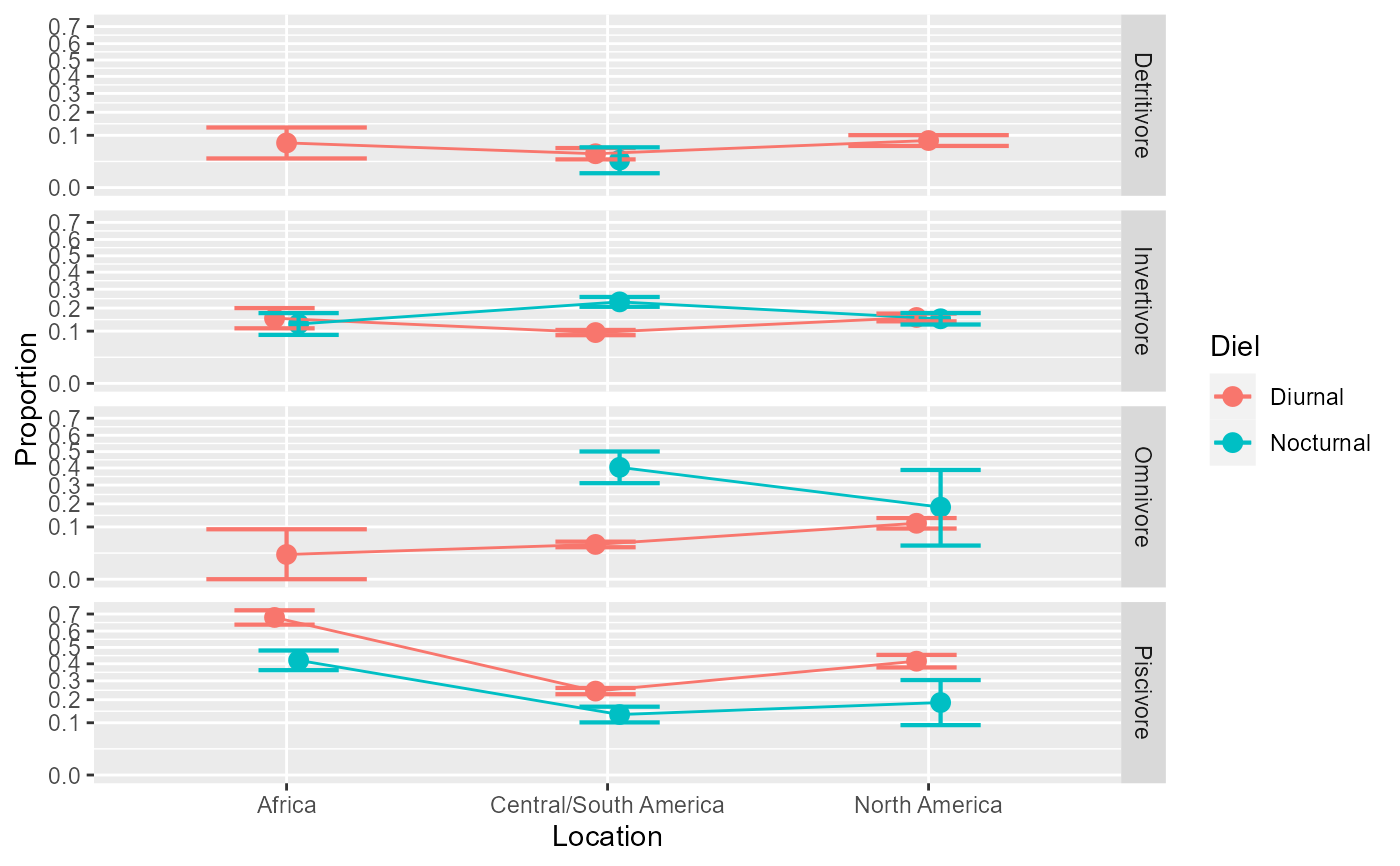
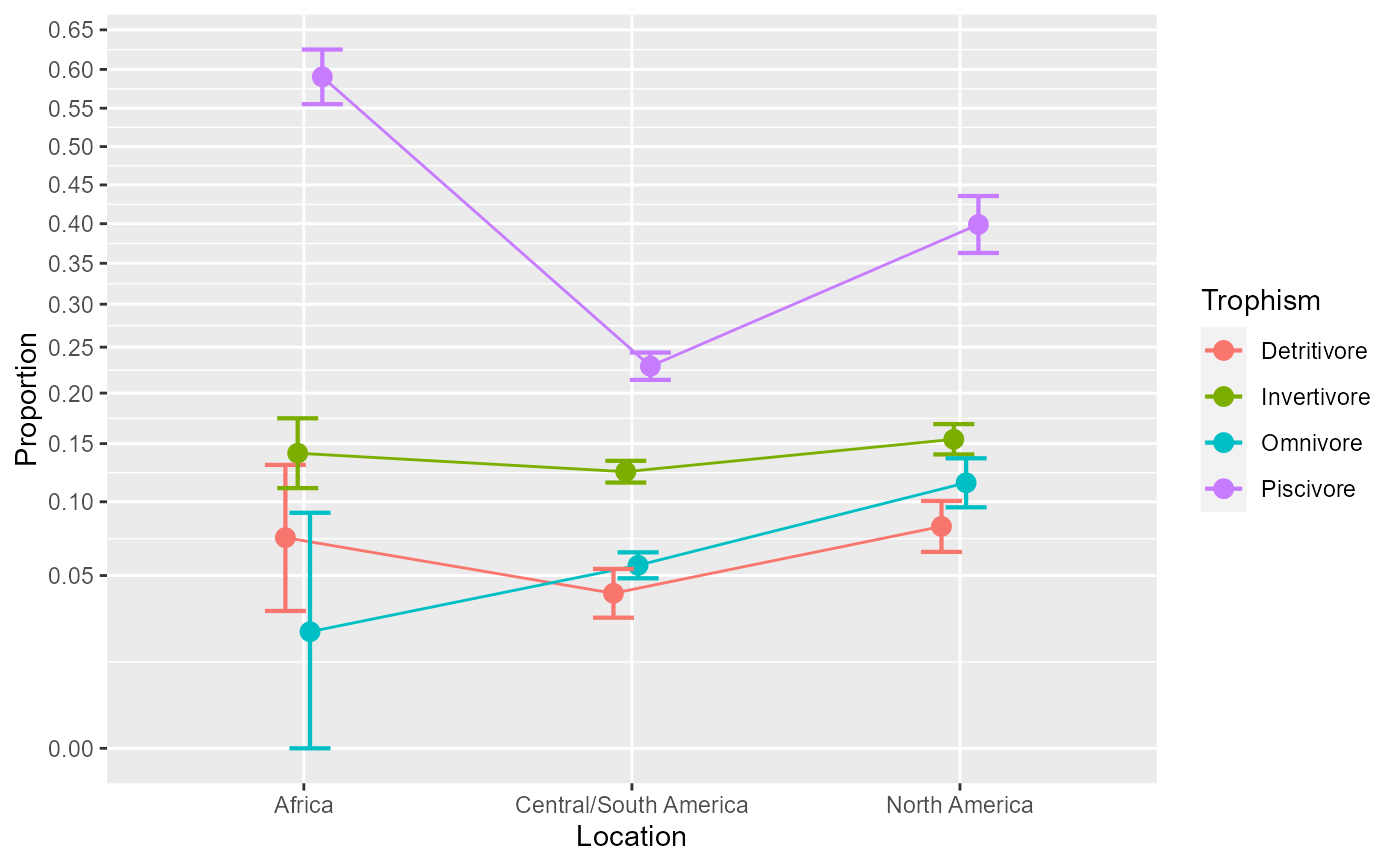
The data, taken from Arrington et al. (2002) , is a dataset examining the distribution of fishes with empty stomachs, classified over three factors: 'Collection location' (3 levels: Africa, Central/South America, North America), 'Diel feeding behavior' (2 levels: diurnal, nocturnal), 'Trophic category' (4 levels: Detrivore, Invertivore, Omnivore, Piscivore). It is therefore a 3 × 2 × 4 design with 24 cells. The original data set also contains Order, Family and Species of the observed fishes and can be obtained from https://figshare.com/collections/HOW_OFTEN_DO_FISHES_RUN_ON_EMPTY_/3297635 It was commented in Warton and Hui (2011) .
ArringtonEtAl2002Format
A data frame.
References
Arrington DA, Winemiller KO, Loftus WF, Akin S (2002).
“How often do fishes “run on empty”?”
Ecology, 83(8), 2145–2151.
doi:10.1890/0012-9658(2002)083[2145:HODFRO]2.0.CO;2
.
Warton DI, Hui FK (2011).
“The arcsine is asinine: The analysis of proportions in ecology.”
Ecology, 92, 3–10.
doi:10.1890/10-0340.1
.
Examples
# see the dataset
ArringtonEtAl2002
#>                 Location    Trophism      Diel    s    n
#> 1                 Africa Detritivore   Diurnal   16  217
#> 2                 Africa Invertivore   Diurnal   76  498
#> 3                 Africa Invertivore Nocturnal   55  430
#> 4                 Africa    Omnivore   Diurnal    2   87
#> 5                 Africa   Piscivore   Diurnal  673  989
#> 6                 Africa   Piscivore Nocturnal  221  525
#> 7  Central/South America Detritivore   Diurnal   68 1589
#> 8  Central/South America Detritivore Nocturnal    9  318
#> 9  Central/South America Invertivore   Diurnal  706 7452
#> 10 Central/South America Invertivore Nocturnal  486 2101
#> 11 Central/South America    Omnivore   Diurnal  293 6496
#> 12 Central/South America    Omnivore Nocturnal   82  203
#> 13 Central/South America   Piscivore   Diurnal 1275 5226
#> 14 Central/South America   Piscivore Nocturnal  109  824
#> 15         North America Detritivore   Diurnal  142 1741
#> 16         North America Invertivore   Diurnal  525 3368
#> 17         North America Invertivore Nocturnal  231 1539
#> 18         North America    Omnivore   Diurnal  210 1843
#> 19         North America    Omnivore Nocturnal    7   38
#> 20         North America   Piscivore   Diurnal  536 1289
#> 21         North America   Piscivore Nocturnal   19  102

# The columns s and n indicate the number of fishes with
# empty stomachs (the "success") and the total number
# of fishes observed, respectively. Thus s/n is the proportion.

# run the ANOPA analysis
w <- anopa( {s; n} ~  Location * Diel * Trophism, ArringtonEtAl2002)
#> ANOPA::fyi(1): Combination of cells missing. Adding:
#>       Location      Diel    Trophism s n
#>         Africa Nocturnal Detritivore 0 0
#>         Africa Nocturnal    Omnivore 0 0
#>  North America Nocturnal Detritivore 0 0
#> Warning: ANOPA::warning(1): Some cells have zero over zero data. Imputing...

# make a plot with all the factors
anopaPlot(w)


# ... or with a subset of factors, with
anopaPlot(w, ~ Location * Trophism)


# Because of the three-way interaction, extract simple effects for each Diel
e <- emProportions( w, {s;n} ~ Location * Trophism | Diel  )

# As the two-way simple interaction for Nocturnal * Diel is close to significant,
# we extract the second-order simple effects for each Diel and each Location
e <- emProportions(w, {s;n} ~ Trophism | Location * Diel  )
# As seen, the Trophism is significant for Noctural fishes of
# Central/South America.