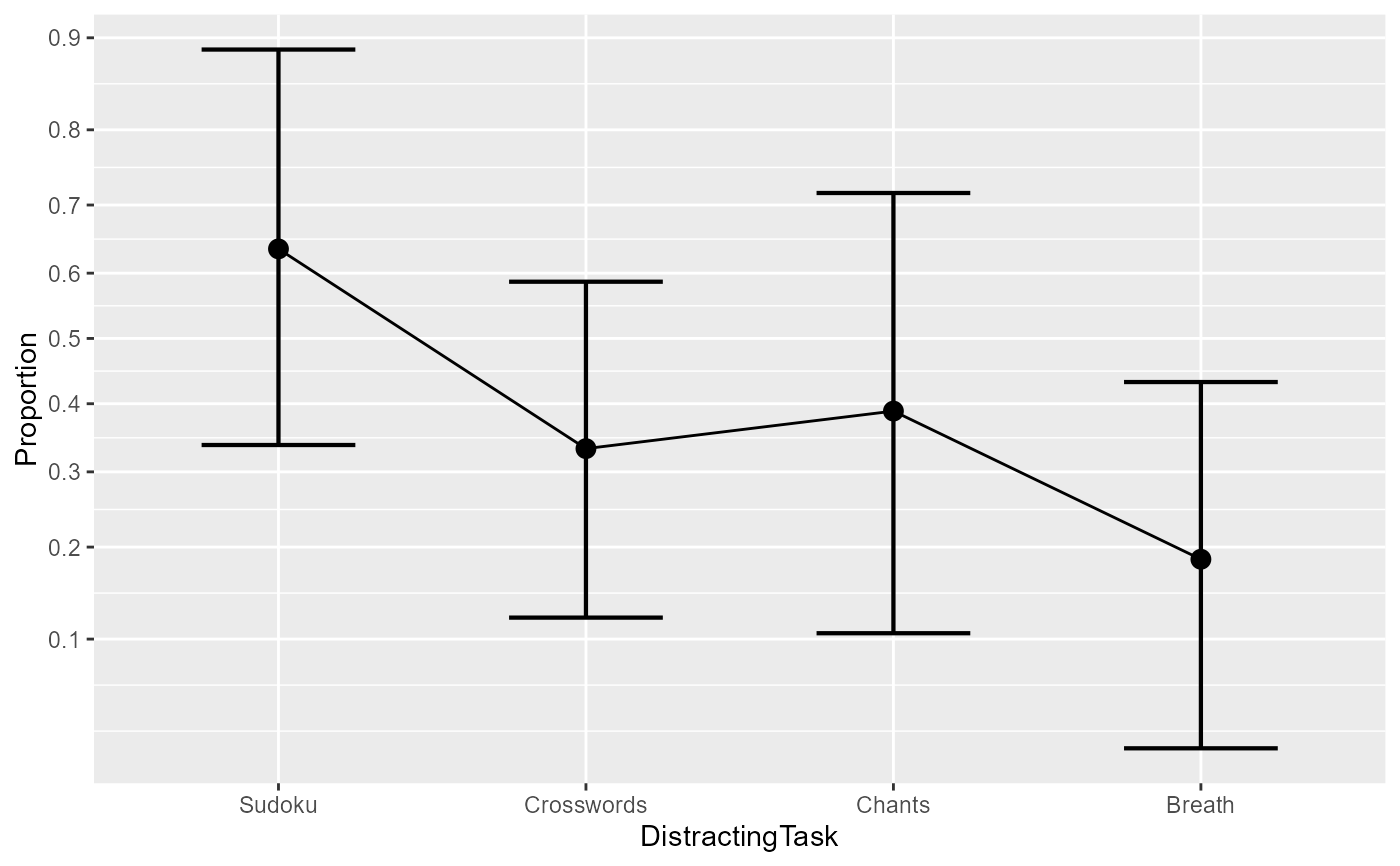
These are the data from the first example reported in (Laurencelle and Cousineau 2023) . It shows fictitious data with regards to the proportion of incubation as a function of the distracting task. The design is a between-subject design with 4 groups.
ArticleExample1Format
An object of class data.frame.
Source
References
Laurencelle L, Cousineau D (2023). “Analysis of proportions using arcsine transform with any experimental design.” Frontiers in Psychology, 13, 1045436. doi:10.3389/fpsyg.2022.1045436 .
Examples
library(ANOPA)

# the ArticleExample1 data shows an effect of the type of distracting task
ArticleExample1
#>   DistractingTask nSuccess nParticipants
#> 1      Crosswords       10            30
#> 2          Sudoku       14            22
#> 3          Chants        7            18
#> 4          Breath        5            27

# We perform an anopa on this dataset
w <- anopa( {nSuccess; nParticipants} ~ DistractingTask, ArticleExample1)

# We finish with post-hoc Tukey test
e <- posthocProportions( w )
#> Not yet programmed...

# a small plot is *always* a good idea
anopaPlot(w)