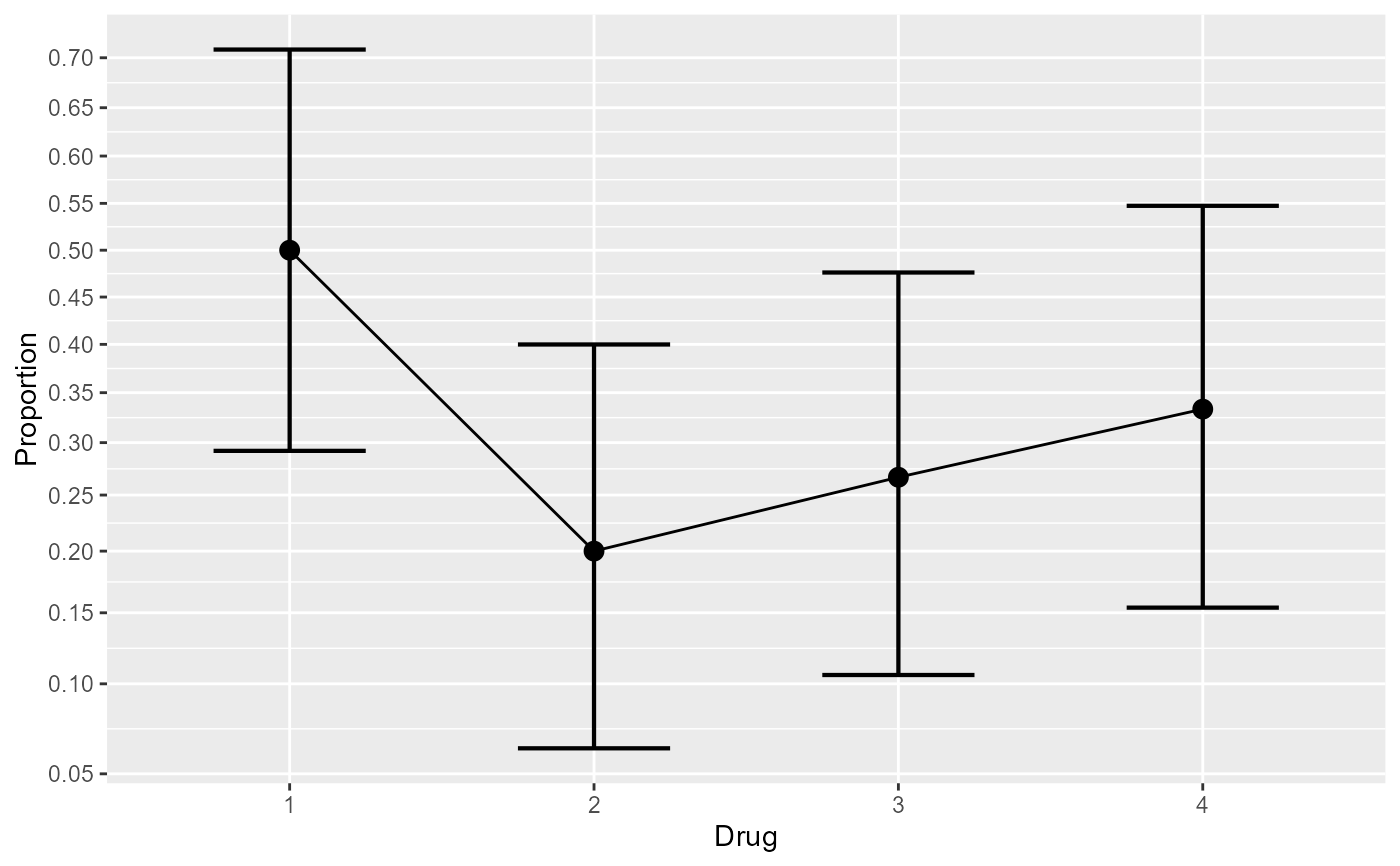
These are the data from the third example reported in (Laurencelle and Cousineau 2023) . It shows fictitious data with regards to the proportion of patients suffering delirium tremens as a function of the drug administered (cBau, eaPoe, R&V, Placebo). The design is a within-subject design with 4 measurements (order of administration randomized).
ArticleExample3Format
An object of class data.frame.
Source
References
Laurencelle L, Cousineau D (2023). “Analysis of proportions using arcsine transform with any experimental design.” Frontiers in Psychology, 13, 1045436. doi:10.3389/fpsyg.2022.1045436 .
Examples
library(ANOPA)

# the ArticleExample3 data shows an effect of the drug administered on the
# proportion of participants who had an episode of delirium tremens
ArticleExample3
#>    cBau eaPoe RnV Placebo
#> 1     1     0   0       0
#> 2     1     1   1       1
#> 3     0     0   0       0
#> 4     1     1   0       0
#> 5     0     0   0       0
#> 6     0     0   0       0
#> 7     1     0   1       1
#> 8     0     0   0       0
#> 9     1     1   0       1
#> 10    0     0   0       0
#> 11    1     0   0       0
#> 12    1     1   1       1
#> 13    0     0   0       0
#> 14    0     0   0       0
#> 15    1     0   0       0
#> 16    0     0   1       1
#> 17    0     0   0       0
#> 18    0     0   0       1
#> 19    1     0   1       0
#> 20    1     0   0       1
#> 21    0     0   0       0
#> 22    1     0   0       0
#> 23    0     1   0       0
#> 24    1     0   1       1
#> 25    1     0   1       0
#> 26    0     0   0       1
#> 27    0     0   0       0
#> 28    0     0   1       0
#> 29    1     0   0       0
#> 30    1     1   0       1

# perform an anopa on this dataset
w <- anopa( cbind(cBau,eaPoe,RnV,Placebo) ~ ., ArticleExample3, WSFactors = "Drug(4)")
#> ANOPA::fyi: Here is how the within-subject variables are understood:
#>  Drug Variable
#>     1     cBau
#>     2    eaPoe
#>     3      RnV
#>     4  Placebo

# We finish with post-hoc Tukey test
e <- posthocProportions( w )
#> Not yet programmed...

# a small plot is *always* a good idea
anopaPlot(w)
