The purpose of superb it to make plots showing adjusted
error bars. However, not everyone are using R. Luckily, for those of you
who are using SPSS, you have three options: 1) R can read SPSS file and
therefore, you can open the data and make the plot in R before returning
to SPSS. 2) It is possible to use SPSS only –from a syntax window– get
access to all the capabilities of superb. 3) Using the
graphical user interface superbShiny, you can also open SPSS files. This
interface is available online as well.
In this vignette, we demonstrate how to use these three options to make a plot with SPSS data.
First option: Using R
Suppose that you have a file called SPSS_Demo.sav. Using
the library foreign, you can open the file and use it in R
to make your plot.
The following syntax for example will open an SPSS file, assuming it is in a folder on your hard drive C:. First, set the working directory and the file name with
setwd("c:")
file <- "Demo_SPSS.sav"
Then you are ready to read the file with the help of the
foreign library
Finally, ask for a plot with
Second option: Using SPSS
The recent versions of SPSS comes bundled with an R interpretor.
Further, if you open a Syntax window (menu File: New: Syntax), you can
send R instructions enclosed within BEGIN PROGRAM R. and
END PROGRAM.
To know if your SPSS installation has R installed, you could for example type these instructions:
then select them all and press Ctrl-R to execute. It R is accepted within SPSS, you should see an ouptut indicating the version of R installed. It has to be R above 4.0.
If things are working, then you are ready to make your plot with
BEGIN PROGRAM R.
    # this will install superb if needed; may take a few minutes
    if(!require(superb))
        install.packages("superb", type="binary")

    # set the library to be in used
    library(superb)

    # transfer the data from SPSS into R
    data <- spssdata.GetDataFromSPSS()

    # all good! make a plot using superbPlot()
    superbPlot(   data,
                  WSFactors      = "Temps(2)",
                  variables      = c("time1","time2"),
                  plotLayout     = "line",
                  adjustments    = list(purpose = "single", decorrelation = "CA"),
                  errorbarParams = list(color = "purple"),
                  pointParams    = list( size = 2, color = "purple")
    )
END PROGRAM.
Here are screen captures showing the syntax window:
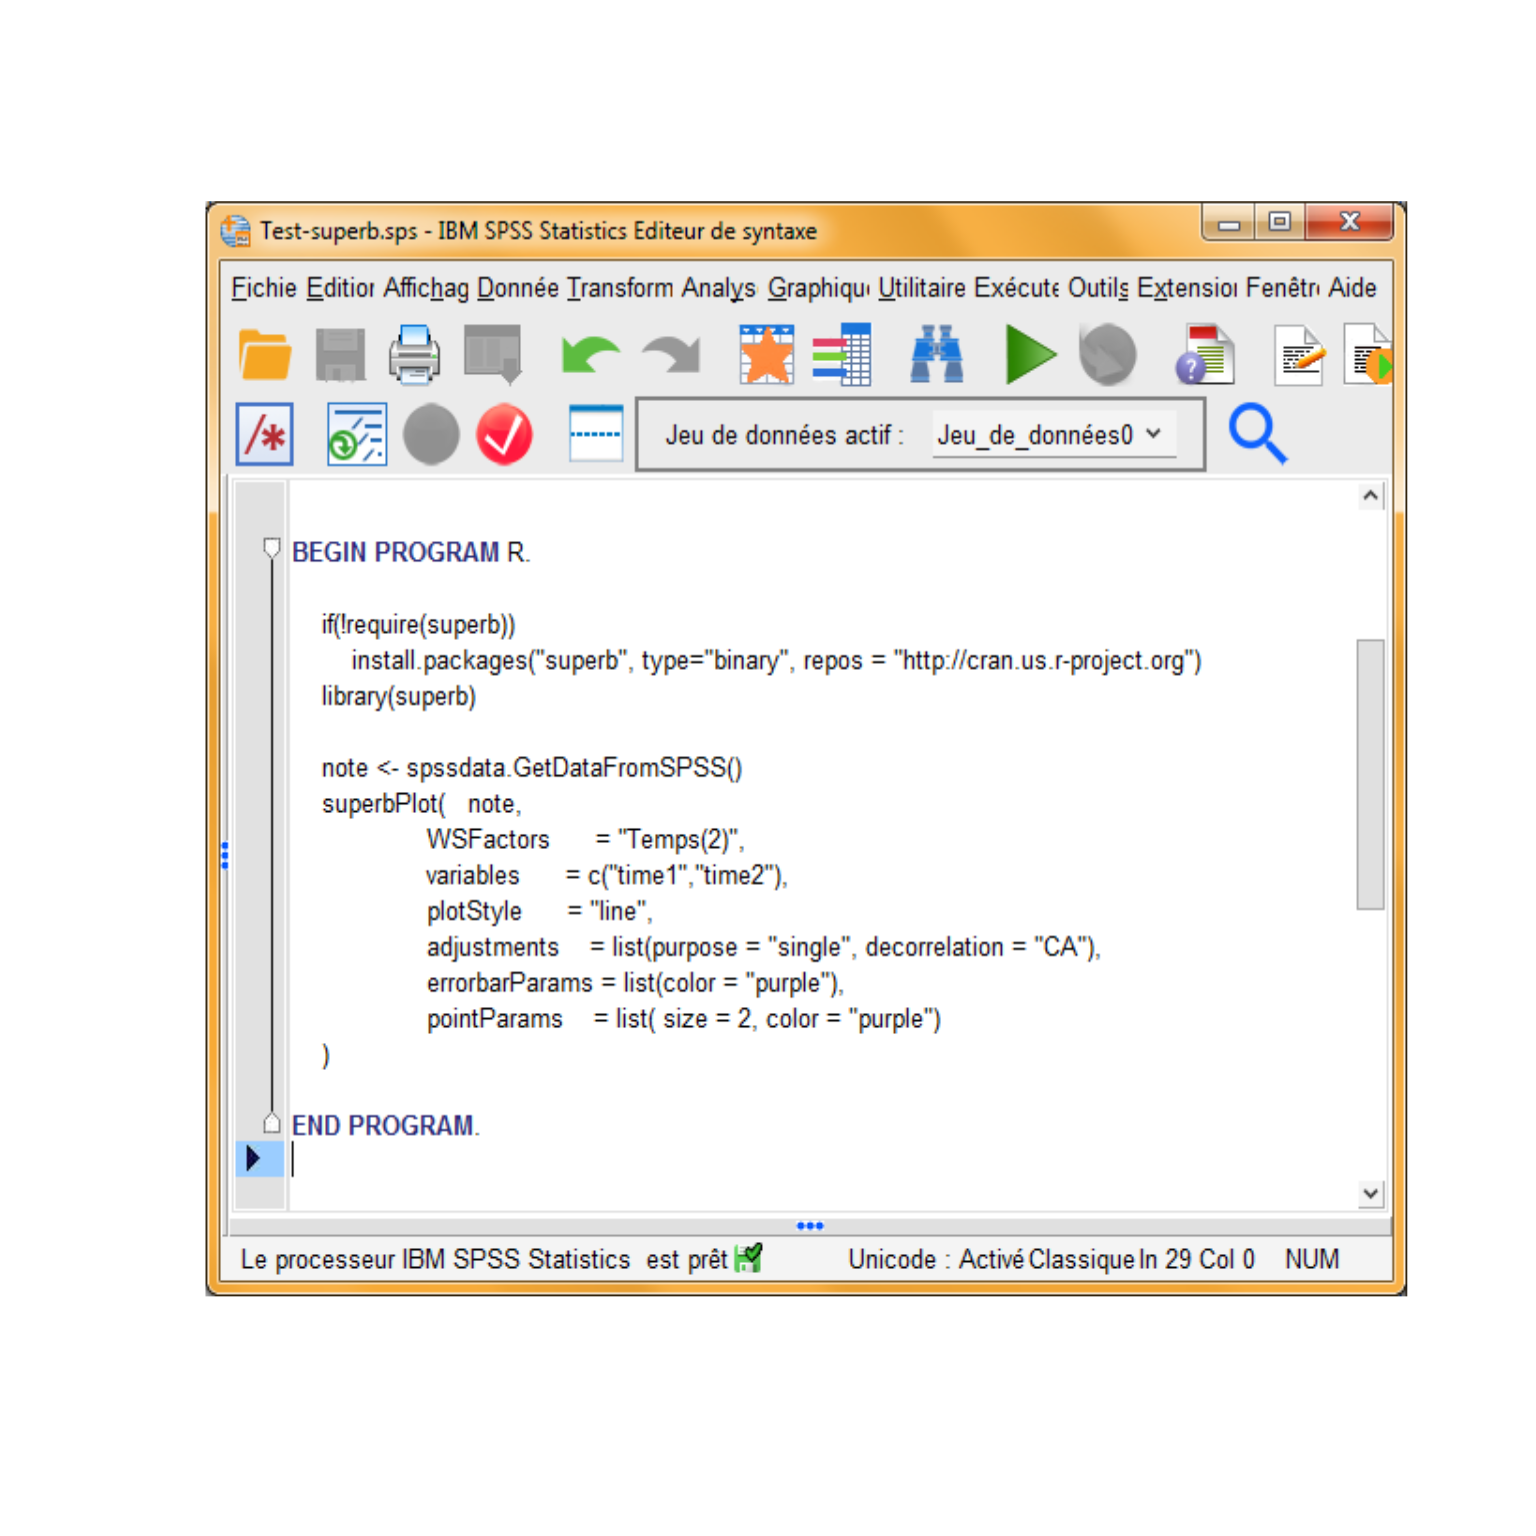
Figure 2: Syntax to generate a plot
Third option: Using a graphical user interface
A graphical user interface is available at this link
This interface can read a few file format, including SPSS files. You can consult a Youtube demonstration here.
In summary
The superb framework can be used to display any summary
statistics. Here, we showed how superbPlot() can be used
with SPSS datasets.
I thank Michael Cantinotti for raising my awarness to the fact that
new versions of SPSS can show plots produced within
BEGIN PROGRAM R. and END PROGRAM. syntax lines
and providing a short example.
References
Cousineau D, Goulet M, Harding B (2021). “Summary plots with adjusted error bars: The superb framework with an implementation in R.” Advances in Methods and Practices in Psychological Science, 2021, 1–46. doi: https://doi.org/10.1177/25152459211035109
Walker, J. A. L. (2021). “Summary plots with adjusted error bars (superb).” Youtube video, accessible here).